
 I just returned from the Atlantic Conference on Eyjafjallajökull and Aviation held in Keflavik, Iceland. It was organized by the Keilir Aviation Academy with sponsorship from ICAO and IATA. As far as I can tell, it’s the first time in recent history that an interdisciplinary meeting has been held on the topic of volcanic disruptions to aviation. There were volcanologists, meteorologists, airlines, air traffic navigation service providers, airports, the military, government regulators, safety people, operations people, policy folks, all under the same roof for the first time. Interesting things happen when you begin sharing each other’s diverse viewpoints.
Early in the meeting, the airlines criticized the UK Met Office for faulty models that forecast ash clouds that led to shutting down airspace across Europe, while the skies were blue and clear of ash. These critics called for less reliance on models and more reliance on actual observations. Also, they called for routine exercises to test out procedures in the event of another eruption. At the conclusion of that first session, as an ad hoc addendum to the agenda, the UK Met Office took the podium and fired back. They said that their transport and dispersion model had been developed transparently over the last 20 years with the participation of some of the best minds in the world. They said that the model was not in error; the ash was in fact present as predicted, but was difficult to see looking up vertically, but ash clearly was present when at altitude looking at it horizontally. And, oh by the way, there had been regular exercises held. Stakeholders had been invited to participate, but most had chosen to ignore invitations. They called for statements based on fact and data, not fiction. Thus the stage was set for an interesting meeting.
I’m not siding with the UK Met Office, but let me address the airlines’ statement about greater reliance on observations versus models. Dealing with volcanic disruptions requires rerouting traffic to avoid volcanic clouds. You have to know when to depart, what route to fly, how much fuel and load to put on the aircraft, and have a reasonably predictable arrival time. You must know where the flights will travel and the capacities of the airspace that will be traversed; capacities are dictated by things like controller staffing, the geometry of fixes and routes, navigational aids and communications, etc. You must know what the demand and capacities look like. You must know what the weather is going to be. All of this merely is meant to say that you need to be able to develop a plan that works for a lot of different organizations and execute that plan in a coordinated way. It’s a complex problem of harmonization, collaboration and synchronization – a ballet. To plan, you must know what is going to happen. Observations don’t tell you what is going to happen; they only tell you what the conditions are right now. So, to plan you need a forecast. To have a forecast, you must have a model. That’s the reason we are advocating the use of each and every observation to continuously and rapidly update forecast models.
Two engine manufacturers, Rolls Royce and Snecma, gave talks about how much volcanic ash turbofan engines can withstand. The work they described covered April 15-18, that first weekend after the eruptions began shutting down airspace across Europe. Previously, the manufacturers’ standing instructions were to simply avoid volcanic ash, period. During that first weekend, it was clear that simply avoiding all ash meant that no flights would be able to operate, and it was unclear how long the eruption might last. Under immense pressure, they scraped together all the data they could find, which was not much. They developed a graph showing ash density vs. degree of impact (similar to a risk-impact matrix in safety risk assessment). Then, they began placing any available data on the chart. There were the two 747 incidents from the 1980s, both at 2 g per m3 and both causing flameouts – high ash density and high safety impact. There was a NASA DC-8 incident in the year 2000, where volcanic ash had no discernable operating impact, but upon later inspection showed serious damage to the engines that required very costly overhaul. In this incident, they had information on volcanic ash particle sizes, but were not able to determine density. No help from this incident. There had been many other volcanic ash incidents, but no useable data on ash densities. So, they turned to some engine tests involving sand ingestion experienced in Middle East operations. The density of sand happened to be in the range of 1-2 mg per m3. Sand is less abrasive and melts at a different temperature than volcanic ash, but at 2 mg per m3, engines were not experiencing significant damage from sand. So, this became the basis for setting a 2 mg per m3threshold, which then enabled aircraft to begin flying again around April 19. While some operators reported ash deposits in their engines, there were no reported cases of permanent engine damage. ICAO suggests delaying the adoption of this density threshold until further study can be completed on engine performance and variations in volcanic conditions on a global basis, but the European standard appears to be set now at 2 mg per m3. If we have another event like this in Europe, it will be interesting to see what happens. Maybe everything will be fine, but the paucity of data leaves open the possibility for massive numbers of engines being damaged. Stay tuned.
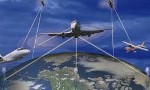
As we watched the Eyjafjallajökull eruption and ensuing disruptions, we felt that some of our Air Traffic Flow Management (ATFM) technologies could be adapted to improve the safety and efficiency of operations in the presence of large, moving volcanic clouds.
We believe that ATFM facilities should be leveraged as part of the solution to volcanic ash disruption problems. On one level, rerouting traffic around volcanic clouds is analogous to strategically rerouting traffic around severe, convective weather systems. This is a job that ATFM has been doing well for many years. On another level, ATFM has nurtured a Collaborative Decision-making (CDM) environment, which enables all of the stakeholders to jointly respond to operational problems. CDM enables air navigation service providers to engage the airlines, general aviation, the military, airport operators, and regulators to collaboratively develop a plan that works for all stakeholders and support the coordinated execution of those plans. One of the advantages of relying on ATFM facilities and personnel is that ATFM is a 24×7 operation. Only modest expansion of functionality and responsibility would be required to support volcanic disruptions. Processes, procedures, people, relationships, trust and the infrastructure are in place and in daily use. These facilities exist or are being built in the US, Canada, Europe, South Africa, Japan, Australia, Mexico, Brazil, Colombia, and several other nations. In contrast, a crisis cell that isn’t used continuously, but only when emergencies occur, may not be able to function nearly as well due to learning curve problems and lack of practice.

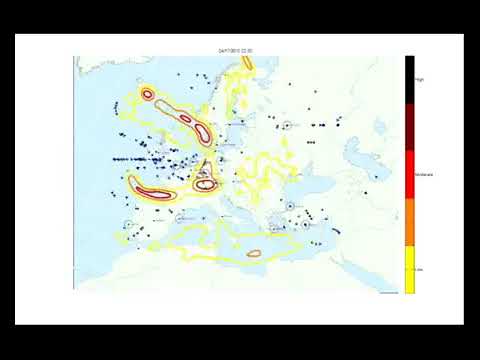
To effectively respond to volcanic disruptions, an optimized traffic flow strategy is needed. We invested in some internal R&D to adapt one of our technologies to use in solving the volcanic ash disruption problem. We prototyped a tool that begins to synthesize optimal traffic flows to maximize the use of open airspace and avoid volcanic clouds while minimizing the cost of flights. This is a sample of an optimized flow strategy synthesized to respond to a forecast of Icelandic volcanic cloud positions and densities. Much more could be done to enhance the performance of this prototype, but it’s clear that it generates a decent solution to a pretty complex problem.
Our prototype that synthesizes optimal flow strategies is off to a great start. But, more work is needed to develop accurate volcanic cloud forecasts. As I mentioned at the outset, forecasts are generated by transport and dispersion models. Models need to know wind forecasts from the surface through cruising altitudes. Temporal resolution of forecasts needs to be down in the range of a few minutes, certainly more frequently than hourly, and spatially at each Flight Level. Models also need input data about the volcanic eruption: the mass of materials injected into the atmosphere, the altitude, the distribution of particle sizes, etc. These are extremely difficult to obtain, so wild guesses or default values are often used in the absence of anything better. For this reason, the first forecast coming out a model will be suspect. But, a wealth of satellite sensors are available, the data from which observations may be obtained. In addition, there are ground-based sensors, balloons, pilot reports, and eventually there may be many more aircraft-based sensors. Observations could be compared with modeled forecasts to enable adjustment of the original model inputs, so that the modeled forecast matches the latest observations. In this way, future forecasts would be much more accurate. This is done today, but the process is largely manual, an art form of sorts. The process needs to be automated and fast, so that each and every observation can be used immediately to improve the accuracy and reliability of forecasts. There has been much good work done in the past that provides many of the required technological capabilities: satellite sensors and processing, ground lidar networks, transport and dispersion models, etc. But, little has been done to integrate these technological capabilities to produce a greatly needed operational capability to support aviation. After studying this problem for the last few months, our conclusions have been further reinforced through the Eyjafjallajökull Conference. We must find a way to leverage huge prior investments and integrate the technologies – connect the dots — for a valuable operational capability.


Connect
Connect with us on the following social media platforms.